Ultimate Guide to Core Web Vitals (LCP, FID & CLS)for SEO
Contents
Google has announced that from Junes 2021, they will start to consider “Page Experience” as part of Search ranking. And Core Web Vitals is a part of page experience.
Now, Google has rolled out the page experience update. Have you checked your website’s Core Web Vitals metrics? Have you passed the Core Web Vitals?
In this post, we’ll discuss everything important for Core Web Vitals, including what Core Web Vitals are, how they affect SEO, how to test and measure web vitals, and how to improve Core Web Vitals.
What Are Core Web Vitals?
Core Web Vitals are a set of specific factors that will be part of Google’s “page experience” score, measuring how users experience the speed, responsiveness, and visual stability of a page. They are designed to improve user experience on the web.
Currently, there are three Core Web Vitals: Largest Contentful Paint (loading performance), Cumulative Layout Shift (visual stability), and First Input Delay (interactivity).
1. LCP (Largest Contentful Paint)
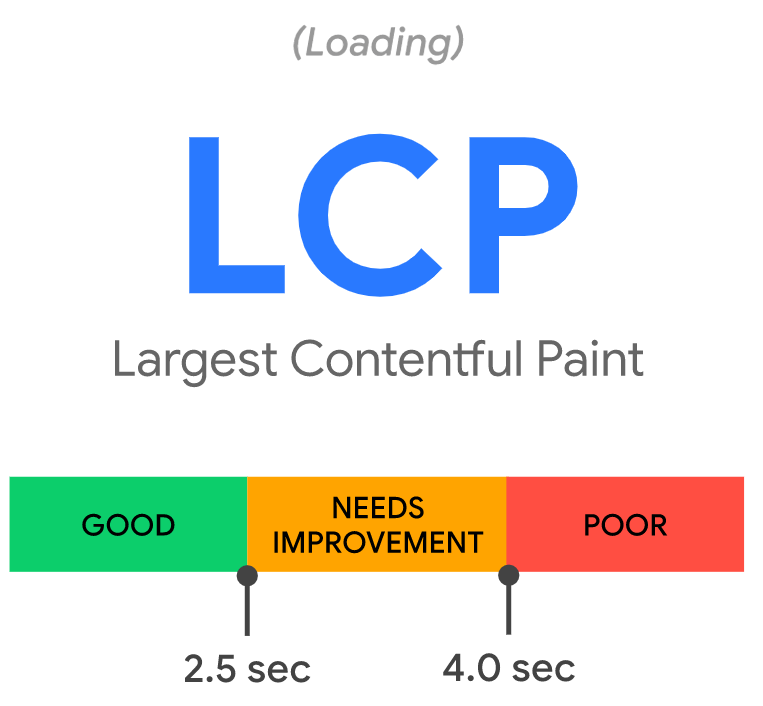
Largest Contentful Paint (LCP) measures how long it takes for the most meaningful content on your site to load. The largest element is typically an image or video, or perhaps a large block-level text element.
Example: You land on a page but don’t see the feature images fully displayed after 3 seconds. It is annoying, right? You would leave the page at this time. Here’s why the Largest Contentful Paint metric is closely related to user experience – more than the overall site’s loading time.
If you’re wondering what a good LCP time is, here are Google’s thresholds:
- Good – Less than or equal to 2.5 seconds
- Needs Improvement – Less than or equal to 4.0 seconds
- Poor – More than 4.0 seconds
2. FID (First Input Delay)
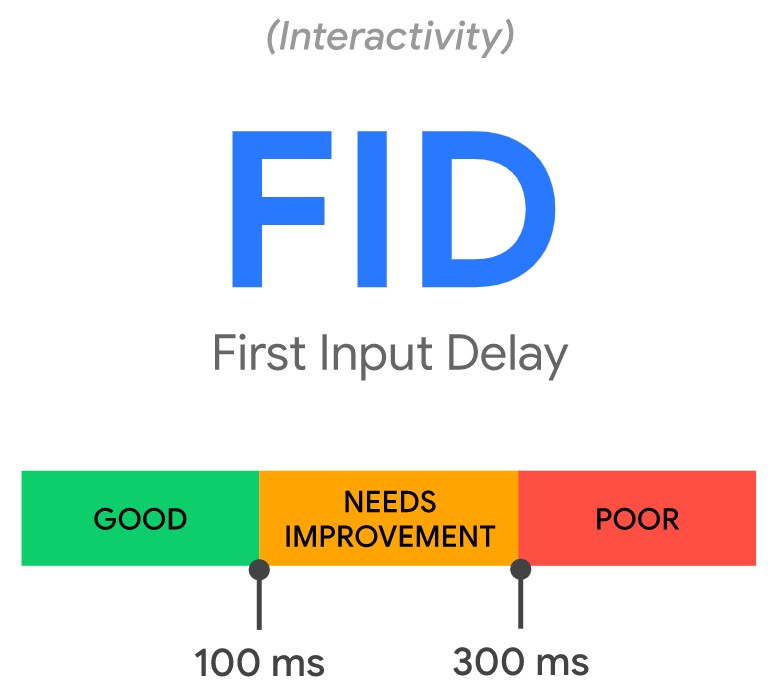
First Input Delay (FID) measures the time between when a user interacts with something on your page (e.g., clicking a button or a link) and when their browser can begin processing that event.
Example: If you click on the “Buy” button on an ecommerce website, how long does it take for the site to respond to that and show the content? If it takes more than 1 second, will you leave?
Here’s how Google defines FID scores:
- Good – Less than or equal to 100 ms
- Needs Improvement – Less than or equal to 300 ms
- Poor – More than 300 ms
3. CLS (Cumulative Layout Shift)
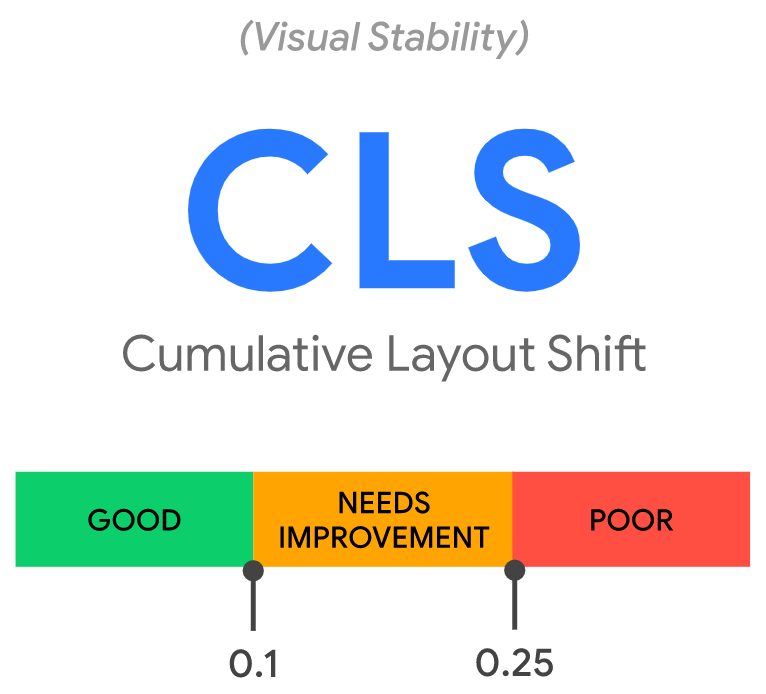
The Cumulative Layout Shift (CLS) measures how much your site’s content “shifts” or “moves around” as it loads. The score is zero to any positive number, where zero means no shifting and the larger the number, the more layout shift on the page.
Example: You’re about to click a link but you cannot do it because your content has just gone up or down after being loaded. You have a terrible user experience, and that’s a layout shift.
Here’s how Google defines the CLS scores:
- Good – Less than or equal to 0.1 seconds
- Needs Improvement – Less than or equal to 0.25 seconds
- Poor – More than 0.25 seconds
Why Are Core Web Vitals Important?
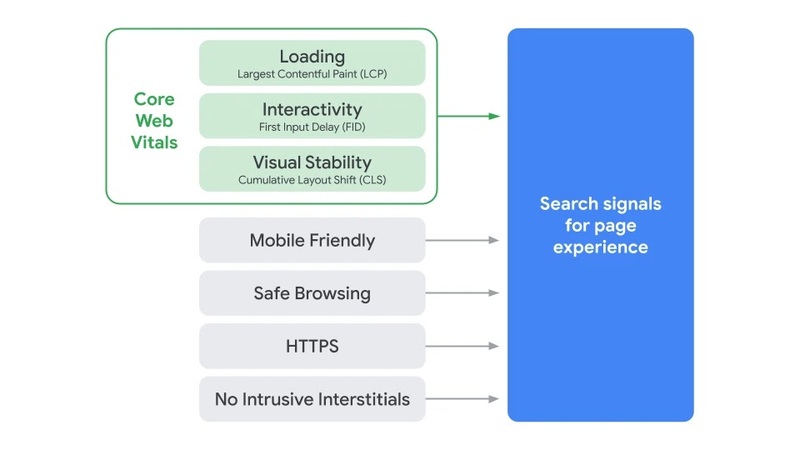
In June 2021, Google has started using “Page Experience” as a ranking factor. And, Core Web Vitals will be part of the new Page experience signals, together with HTTPS-security, safe-browsing, mobile-friendliness, and intrusive interstitial guidelines. Therefore, Core Web Vitals could affect your SEO performance.
In 2020, Google released a whole video about the relationship between the Core Web Vitals and SEO.
How to Test and Measure Core Web Vitals?
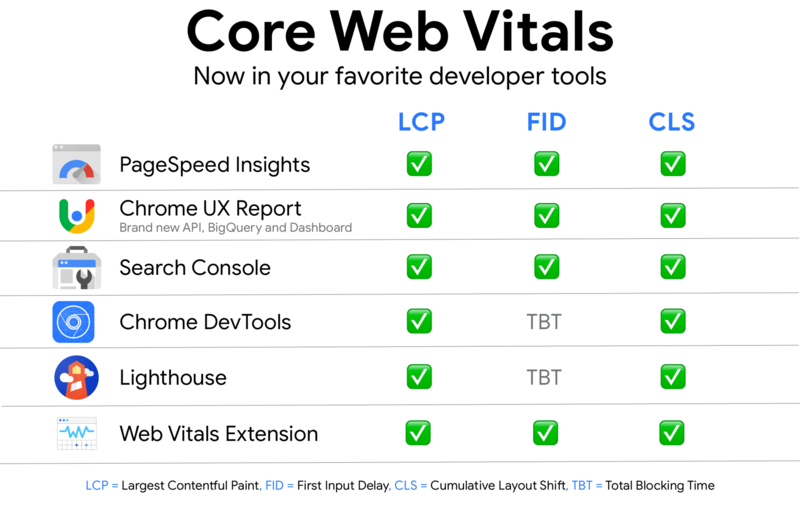
You can test and measure the Core Web Vitals with all of Google’s tools for web developers, from PageSpeed Insights to the Chrome DevTools, the CrUX Report, and much more.
As you can see in the image below, Google’s tools measure all the three metrics — except for Chrome DevTools and Lighthouse.
These two tools use the Total Blocking Time as a proxy for the First Input Delay. That’s because FID can only be measured with real user data (Field Data), whereas Lighthouse only provides Lab Data.
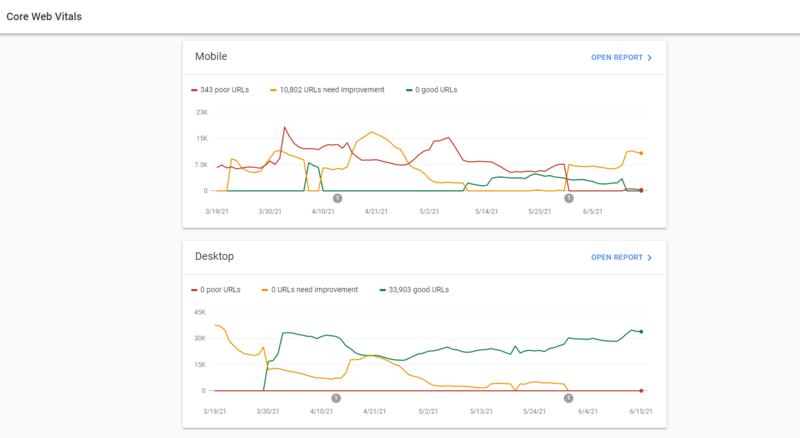
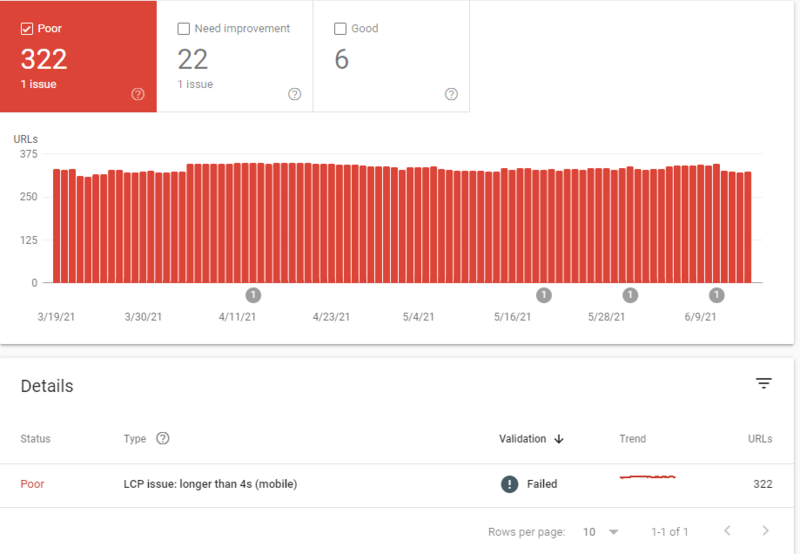
The easiest way to see the metrics for your site is with the Core Web Vitals report in Google Search Console. With the report, you can easily see if your pages are categorized as “poor URLs,” “URLs need improvement,” or “good URLs.”
Status metrics are evaluated against the following boundaries:
| Good | Needs improvement | Poor | |
| LCP | <=2.5s | <=4s | >4s |
| FID | <=100ms | <=300ms | >300ms |
| CLS | <=0.1 | <=0.25 | >0.25 |
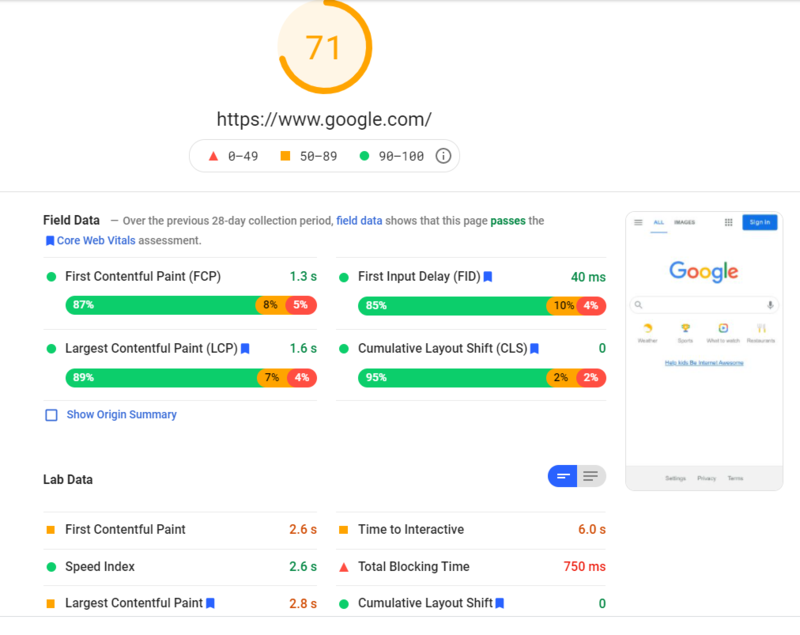
You can also test your site’s pages against Core Web Vitals is via Google PageSpeed Insights. It provides data on all three metrics and gives specific recommendations to improve their performance.
How to Fix Core Web Vitals Errors?
Now for the most important question – if your website currently cannot meet the Google’s standards for the three Core Web Vitals metrics, how can you optimize your site to improve your Core Web Vitals scores?
The strategies are different for each metric. Let me now show you the ways you can use to fix Core Web Vitals issues one by one.
If you want to read the text, you can watch the video below.
1. Fix Largest Contentful Paint (LCP) Issues
To learn how to improve LCP, we first should know what factors affects LCP and cause a “Poor” score.
The most common causes of a poor LCP are:
- Slow server response times
- Render-blocking JavaScript and CSS
- Slow resource load times
- Client-side rendering
Responding to the causes of poor LCP, there are five ways to improve your LCP.
1) Optimize Server Response Times
First of all, you can use Time to First Byte (TTFB) to measure your server response times. The Opportunities section of your Lighthouse report reports Time to First Byte, the time that it takes for a user’s browser to receive the first byte of page content.
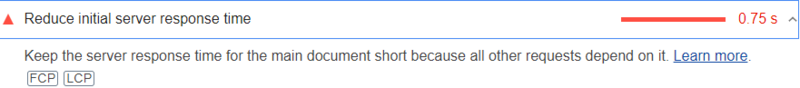
However, sometimes you may fail to find it. That’s because this audit fails when the browser waits more than 600 ms for the server to respond to the main document request.
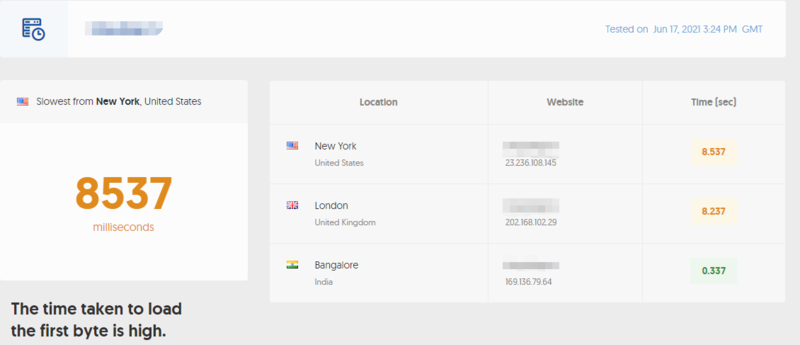
For example, one of test pages’ TTFB is 8537 ms. I cannot find its TTFB data in Lighthouse reports. If you cannot find the server response time in Lighthouse reports. Try to use other TTFB tools to figure it out and it is most likely higher than 600 ms.
If your TTFB is too high, then you can improve your TTFB in a number of different ways:
- Optimize your server
- Route users to a nearby CDN
- Cache assets
- Serve HTML pages cache-first
- Establish third-party connections early
- Use signed exchanges
2) Reduce CSS Blocking Time
Ensure that only the minimal amount of necessary CSS is blocking render on your site with the following:
- Minify CSS
- Defer non-critical CSS
- Inline critical CSS
3) Reduce JavaScript Blocking Time
Download and serve the minimal amount of necessary JavaScript to users. Reducing the amount of blocking JavaScript results in a faster render, and consequently a better LCP.
This can be accomplished by optimizing your scripts in a few different ways:
- Minify and compress JavaScript files
- Defer unused JavaScript
- Minimize unused polyfills
4) Optimize Resource Load Times
The goal with LCP is to get useful content onto the screen as fast as possible. The elements like videos and images also have a direct effect on LCP. There are a few ways to ensure these files are loaded as fast as possible:
- Optimize and compress images
- Preload important resources
- Compress text files
- Deliver different assets based on network connection (adaptive serving)
- Cache assets using a service worker
5) Limited and Optimized Client-Side Rendering
When building a client-side rendered site, consider the following optimizations:
- Minimize critical JavaScript
- Use server-side rendering
- Use pre-rendering
2. Fix First Input Delay (FID) Issues
A slow FID most often occurs because the site is waiting for JavaScript and/or CSS elements to load. Everything seems to be working, the content has loaded, but the page cannot yet respond to the user’s request.
The main cause of a poor FID is heavy JavaScript execution. Optimizing how JavaScript parses, compiles, and executes on your web page will directly reduce FID.
To improve this:
- Break up long tasks into smaller, asynchronous tasks.
- Generate as much content as you can statically, server-side.
- Explore the on-demand loading of third-party code.
- Use a web worker
- Defer unused JavaScript
- Minimize unused polyfills
- Idle until urgent
3. Fix Cumulative Layout Shift (CLS) Issues
The same, we first need to know what causes layout shift issues before fixing it.
According to Google, the most common causes of high CLS are:
- Images without dimensions
- Ads, embeds, and iframes without dimensions
- Dynamically injected content
- Web fonts causing FOIT/FOUT
- Actions waiting for a network response before updating the DOM
And here are corresponding ways to fix CLS issues.
1) Include Width and Height Attributes On Image and Video Elements
It is simple practice – always include width and height size attributes on your images and video elements.
It looked like this:
<img src=”example.jpg” width=”800″ height=”300″ alt=”Example Image”>
2) Setting Dimensions On Ads and Embeds
Ads are one of the largest contributors to layout shifts on the web. Ad networks and publishers often support dynamic ad sizes. Owing to higher click rates and more advertisements competing in the auction, ad sizes improve efficiency and hence revenue. Sadly, due to ads pushing visible content that you are viewing down the page, this can lead to suboptimal user experience.
You can try these steps to reduce the chances of high CLS because of ads:
- Reserve space statically for ad slot. That is to say, style the item before loading the ad tag library.
- When putting ads in the content flow, make sure the slot size is allocated to avoid shifts. If loaded off-screen, those ads will not trigger layout shifts.
- When putting non-sticky ads near the top of the viewport, take extra care.
- Avoid collapsing the allocated space if a placeholder shows no ad when the ad slot is available.
- Eliminate layout shifts by reserving the ad slot with the widest possible duration.
- Use historical data to choose the most likely size for the ad slot.
3) Properly Handle Dynamically Injected Content
Never inject content above existing content, except for user interaction. This ensures anticipation of any layout shifts that occur.
4) Using Font:Display Values and Link Rel=Preload
If your site is using fonts hosted online, they might be the main cause of FOIT (Flashes Of the Invisible Text) and FOUT (Flashes Of the Unstyled Text).
When the browser downloads the fonts from the server, it often displays blank space until the custom font loads. After downloading and displaying the font, the layout usually moves quite a lot. It’s called FOIT (Flashes of the Invisible Text).
Another scenario occurs when the browser displays one of the system fonts until the custom one is downloaded. We call that FOUT (Flashes of The Unstyled Text). Since the system font may differ from the custom one, it may take up a different amount of space. Because of that, the layout of your site might move significantly after your custom font loads.
To avoid this, you can use font:display values such as auto, swap, block, fallback, and optional. For an even better result, you can also preload font files using <link rel=preload> for key fonts – this way they will be downloaded as a priority asset.
5) Improve HTTP Response & Elements Synchronization
Slow server HTTP response may also cause issues with the content layout. When you are using a CDN, loading of the indented elements takes quite a few milliseconds. That causes the content to jump. You then need to either build a space in DOM or synchronize the load with other elements.
Conclusion
That’s it for this guide.
Implementing the topics discussed in this article will improve Core Web Vitals on your website, enhance the user experience, improve SEO ranking, and contribute to site conversion goals.
Make sure to check the Core Web Vitals report at least once a month. Sometimes issues can pop-up in unexpected places and remain undetected for a long time.