27 Facebook Statistics & Facts to Inform Your SMO Strategy
Contents
- Part 1: General Facebook Statistics
- Part 2: Facebook User Demographic Statistics
- Part 3: Facebook Usage Statistics
- #8. Facebook Users Spend 34 Minutes Per Day Using the Platform
- #9. 70% Facebook Users Use the Platform Daily
- #10. 1.8 Billion People Use Facebook Groups
- #11. Brands Publish Approximately 5.5 Facebook Posts Per Week
- #12. Facebook Users Almost Exclusively Use Mobile to Access Facebook
- #13. Two-Thirds of Facebook Users Visit a Local Business Page Weekly
- Part 4: Facebook Marketing Statistics
- #14. 87.1% Of US Marketers Use Facebook
- #15. There Are Over 80 Million Business Pages On Facebook
- #16. 15% Of All Facebook Content Is Video
- #17. The Average Organic Reach for A Facebook Post Is 6.4% Of The Page’s Likes
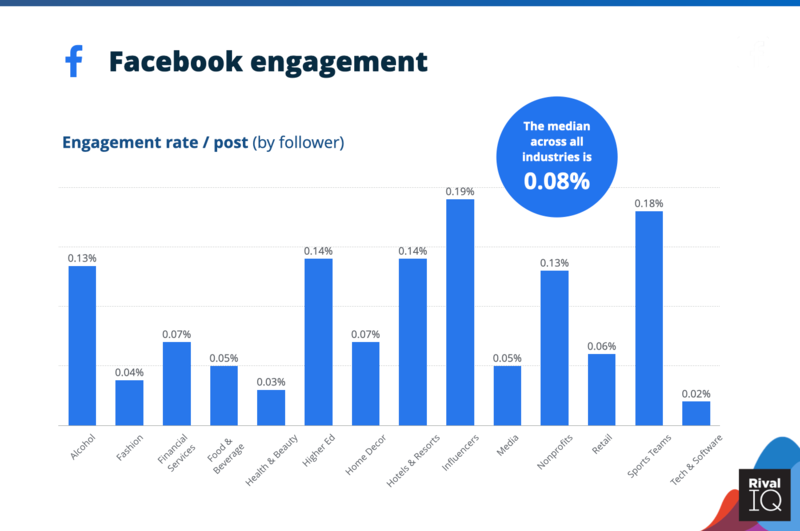
- #18. The Average Engagement Rate for Facebook Posts is 0.08%
- #19. The Average Engagement Rate for Facebook Video Posts is 0.26%
- #20. What Are the Most-Followed Facebook Pages?
- #21. Who Has the Most Followers On Facebook?
- Part 5: Facebook Advertising Statistics
- #22. Facebook Has Over 10 Million Advertisers
- #23. Facebook Ad Spend Reached $31.43 Billion in 2020
- #24. Facebook Has the Most Ads & Highest CTR
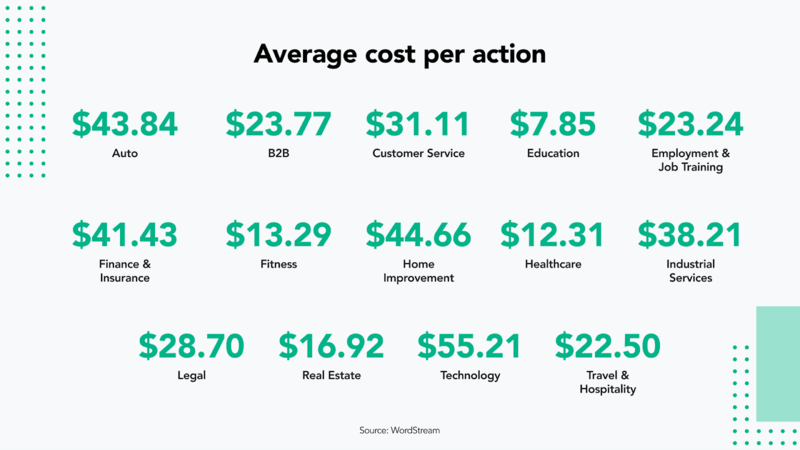
- #25. The Average Cost Per Action (CPA) For Facebook Ads Across All Industries Is $18.68.
- #26. The Average Facebook CPM is $5.31 & CPC Is $0.43
- #27. Video and Share Ads Have the Highest Cost Per Click and Cost Per Mille
- Wrapping up
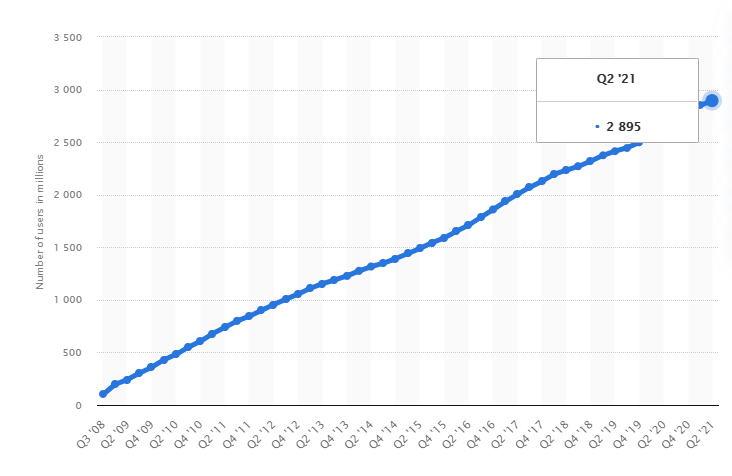
With roughly 2.89 billion monthly active users as of the second quarter of 2021, Facebook is the biggest social network worldwide. At this point, it’s safe to say that your audience is using Facebook, and your competitors too.
Aside from the number of Facebook users, many other Facebook statistics may help you to create your SMO strategy.
Let’s check.
Part 1: General Facebook Statistics
#1. Facebook Has 2.89 Billion Monthly Active Users
With roughly 2.89 billion monthly active users as of the second quarter of 2021, Facebook is the biggest social network worldwide. In the third quarter of 2012, the number of active Facebook users surpassed one billion, making it the first social network ever to do so.
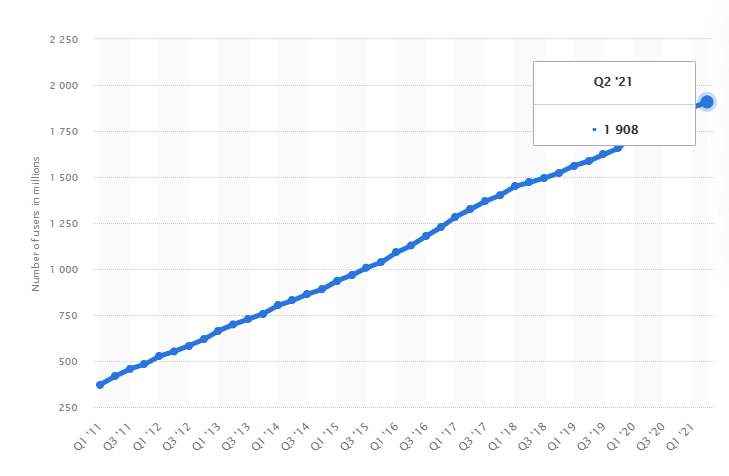
#2. 1.9 BILLION Users On Average Visit Facebook Every Day
During the second quarter of 2021, Facebook reported almost 1.9 billion daily active users (DAU). Overall, daily active users accounted for 66 percent of monthly active users.
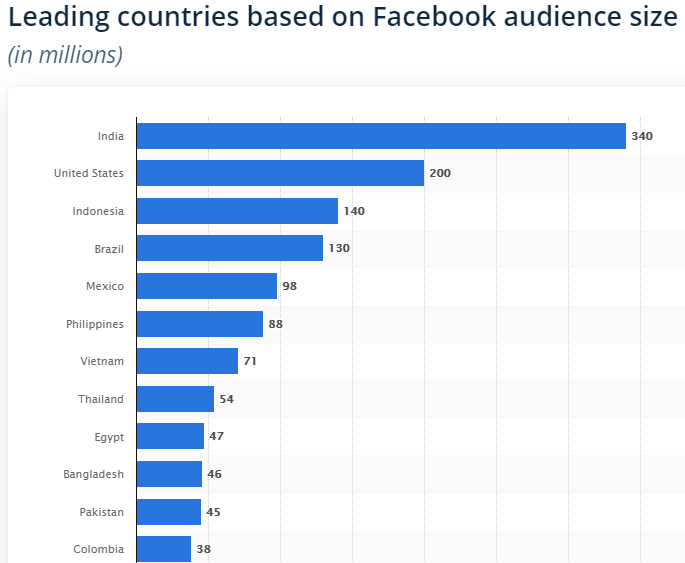
#3. India Is the Largest User Base with The Most Active Facebook Users
There are over 340 million Facebook users in India alone, making it the leading country in terms of Facebook audience size. Apart from India, there are several other markets with more than 100 million Facebook users each: The United States, Indonesia, and Brazil with 200 million, 140 million, and 130 million Facebook users respectively.
#4. 66% Of The Entire UK Population Are Facebook Users
Out of the total estimated UK population of 67.9 million, approximately 44.84 million people are active Facebook users – approximately 66% of the total UK population.
Part 2: Facebook User Demographic Statistics
#5. Users Ages 25–34 Years Are the Largest Demographic
As of July 2021, it was found that 9.4 percent of total active Facebook users worldwide were women between the ages of 18 and 24 years, while male users between the ages of 25 and 34 years constituted the biggest demographic group on the social media platform.
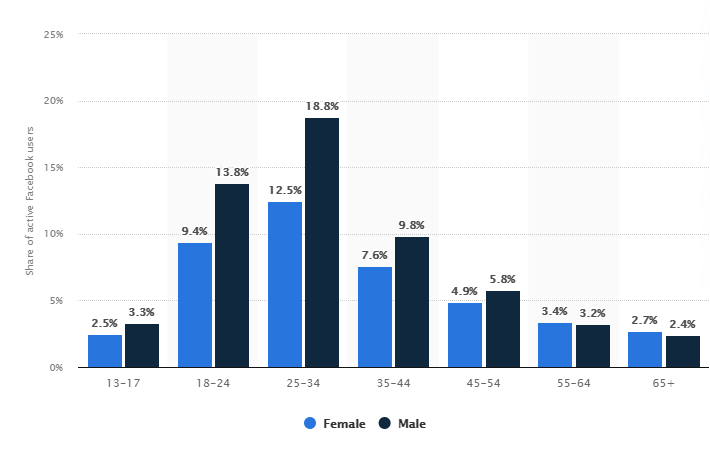
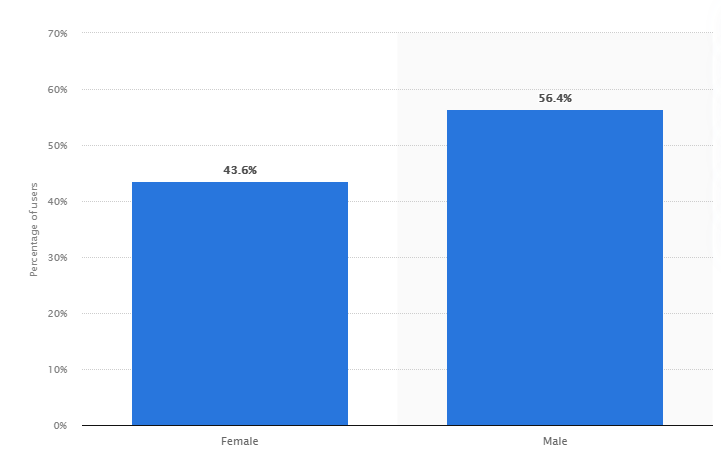
#6. 56% Of Facebook User Are Men
Close to 44 percent of Facebook audiences were female and 56 percent were male.
For comparison, Instagram is almost equally split between men and women.
#7. Only 51% Of Us Teenage Users Use Facebook
2015 data showed that 71% of American Teens were active on Facebook, while in 2020 only 51% of teenage users were active on Facebook.
Part 3: Facebook Usage Statistics
#8. Facebook Users Spend 34 Minutes Per Day Using the Platform
eMarketer had predicted a drop in time spent on Facebook in 2020, but the pandemic changed that.
#9. 70% Facebook Users Use the Platform Daily
Seven-in-ten Facebook users say they use the site daily, including 49% who say they use the site several times a day.
#10. 1.8 Billion People Use Facebook Groups
And there are tens of millions of groups on Facebook.
Businesses and brands can create Facebook Groups of their own to interact with existing fans, or explore ways to connect with potential customers through existing public groups.
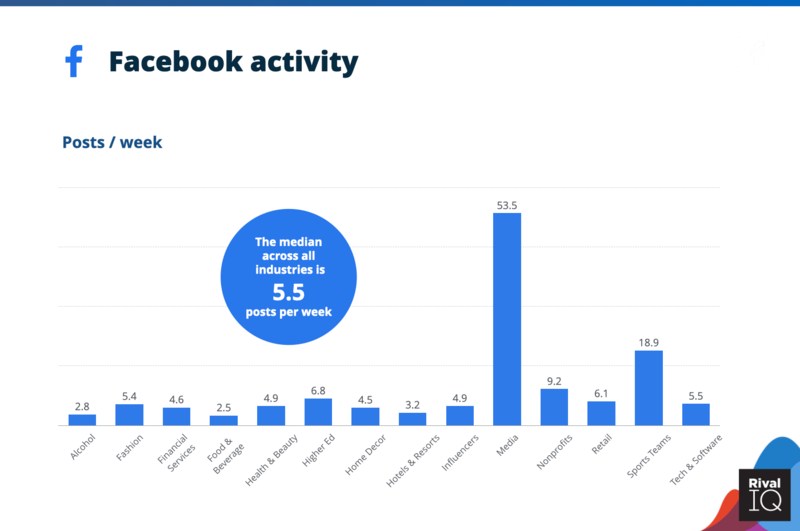
#11. Brands Publish Approximately 5.5 Facebook Posts Per Week
The media industry has the highest number of Facebook posts published at 53.5 per week.
Sports teams and non-profits are also other high-publishing industries at 18.5 and 9.2 posts each week, respectively.
Food and beverages are at the lower end at an average of 2.5 per week.
This brings the median to 5.5 posts per week across all industries on Facebook.
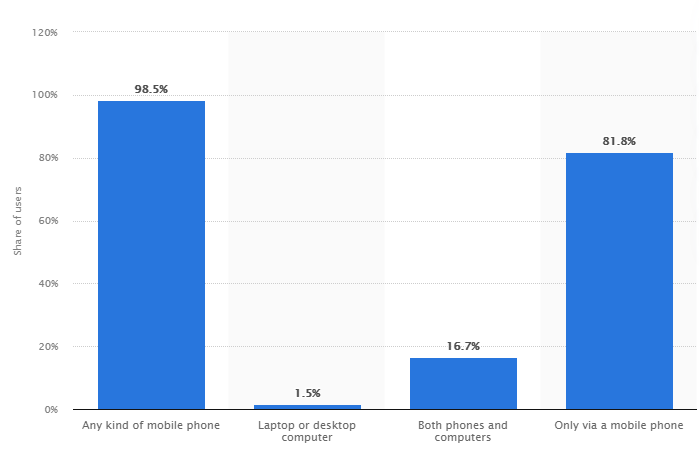
#12. Facebook Users Almost Exclusively Use Mobile to Access Facebook
Facebook is the biggest social network worldwide, and its accessibility through multiple mobile apps as well as its mobile website plays a large part in its success. In July 2021, over 98 percent of active user accounts worldwide accessed the social network via any kind of mobile phone.
#13. Two-Thirds of Facebook Users Visit a Local Business Page Weekly
Across all the countries that Facebook users are in, two-thirds of them report visiting the Page of a local business at least once a week.
Part 4: Facebook Marketing Statistics
#14. 87.1% Of US Marketers Use Facebook
In 2021 87.1% of US marketers will be using Facebook. 90 million small businesses use the platform for marketing purposes.
#15. There Are Over 80 Million Business Pages On Facebook
Across the world, there are over 80 million business pages on Facebook which are used by over 2 billion users across the globe.
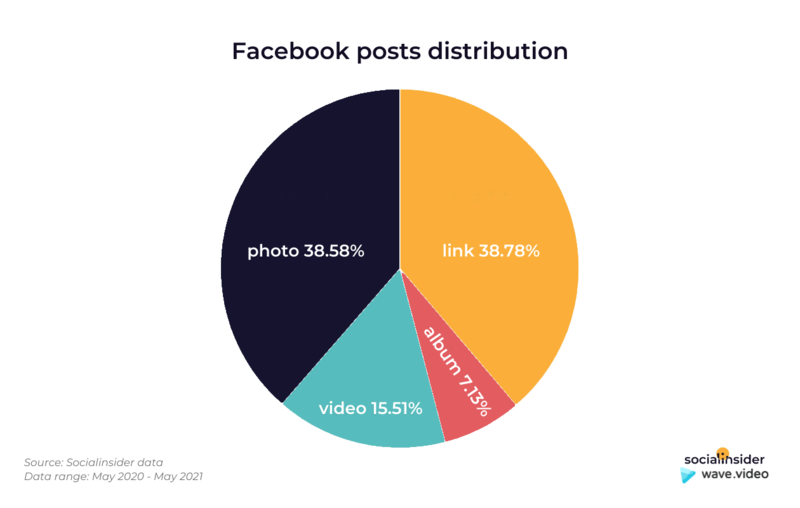
#16. 15% Of All Facebook Content Is Video
Facebook’s video usage is increasing, reaching a percentage of 15.5% in 2021. Bigger accounts, typically owned by bigger brands, are posting 16.83% of Facebook video content.
#17. The Average Organic Reach for A Facebook Post Is 6.4% Of The Page’s Likes
Facebook’s algorithms have decreased the reach of organic posts — this means, to get more eyes on your content, you have to pay to boost it.
#18. The Average Engagement Rate for Facebook Posts is 0.08%
Posts from influencers and sports teams has highest engagement rate.
#19. The Average Engagement Rate for Facebook Video Posts is 0.26%
Remember that the average engagement rate overall is just 0.08%. That’s strong motivation to incorporate video content in your marketing strategy.
#20. What Are the Most-Followed Facebook Pages?
The top five most popular Facebook pages are: Facebook (214,617,638 followers), Samsung (159,802,273 followers, Cristiano Ronaldo (122,524,428 followers), Real Madrid C.F. (111,182,379 followers), and Coca-Cola (107,296,593 followers).
#21. Who Has the Most Followers On Facebook?
Cristiano Ronaldo is currently the most-followed individual on Facebook, with 149 million followers.
Part 5: Facebook Advertising Statistics
#22. Facebook Has Over 10 Million Advertisers
In the third quarter of 2020, Facebook stated that 10 million active advertisers were using the social networking platform to promote their products and services, up from seven million advertisers in the first quarter of the previous year.
#23. Facebook Ad Spend Reached $31.43 Billion in 2020
Despite the uncertainties presented by COVID-19, Facebook’s ad revenues grew by 4.9% in 2020. And they’re poised to increase by a whopping 22% in 2021
#24. Facebook Has the Most Ads & Highest CTR
Facebook Ads Manager offers four different ad placements: Facebook, Instagram, Messenger and Audience Network. Of these four, Facebook dominated at 45.2% of ads placement preference with good reason. The click-through rate (CTR) on Facebook is 3.90%, much higher than the next placement of Audience Network at 0.99%.
#25. The Average Cost Per Action (CPA) For Facebook Ads Across All Industries Is $18.68.
It’s now more expensive than ever to reach your audience on Facebook
#26. The Average Facebook CPM is $5.31 & CPC Is $0.43
Across all channels that are available in Facebook’s Ads Manager, the average cost per thousand (CPM) is $5.31. This number steadily rose through 2020. For the average cost per click (CPC), though, the number remained relatively stable at $0.43.
The average CPC for video ads is $0.55, and for share ads $0.49.
Wrapping up
And there you have it! If you are ready to take your social media marketing efforts to the next level and push ahead of the competition, these Facebook statistics may help you a lot.