App Store and Google Play App Conversion Rate Benchmarks (2023)
Contents
When it comes to App store optimization, we have two goals. One is to increase our apps’ visibility and the other is to increase app conversion rate. Therefore, many app developers and marketers refer to conversion rate (CVR) – the proportion of store visitors that download your app after viewing its page – as a key ASO metric to monitor.
Then, what’s a good app conversion rate? Where do we stand across the industry? To get started, we’ve outlined the CVR benchmark which analyzes the conversion rate for apps and games.
Here we go.
1. Average Conversion Rate and Install Rate in App Store
First of all, we should explain what are conversion rate and install rate in Apple App Store.
When analyzing your app store conversion rate, there are two metrics you should consider:
- Conversion Rate (App Unit/Page Views): The percentage of users that download your app after viewing its page. This metric is used across the ASO community when referring to app store conversion rates. It can give you an idea of how well your app page convinces users to download your app. On the App Store, it is possible to have a conversion rate greater than 100%. In this case, the number of first-time installs would exceed the number of app page views. This would indicate that most people download your app directly from the search or browse results, without visiting your app page first.
- Install Rate (App Unit/Impressions): The percentage of users that download your app directly from the app store search or browse results, without clicking through to your app page. The install rate tells you how well your app stands out in the app store search/browse results.
Note: The App Unit is the number of first-time app purchases made on the app store (including both paid and free apps).
Average Conversion Rate and Install Rate on Apple US App Store
According to Apptweak, in 2022, the average conversion rate in the US App Store was 31%. However, this figure fluctuated greatly between categories and should therefore be handled with caution. For instance, the Weather category has highest conversion rate with 86% and Games (Card) category has lowest conversion rate with 2.9%.
| Category | Average Conversion Rate (US App Store) | Average Install Rate (US App Store) |
| AVERAGE | 31.0% | 4.00% |
| Books | 74.2% | 6.70% |
| Business | 39.4% | 4.20% |
| Education | 24.4% | 2.50% |
| Entertainment | 12.2% | 2% |
| Finance | 19.6% | 3.40% |
| Food & Drink | 31.2% | 6.30% |
| Games | 8.0% | 1.60% |
| Games – Action | 8.8% | 1.60% |
| Games – Adventure | 13.4% | 1.90% |
| Games – Board | 4.1% | 0.80% |
| Games – Card | 2.9% | 1.70% |
| Games – Casino | 6.5% | 3.80% |
| Games – Casual | 9.6% | 2.40% |
| Games – Family | 5.3% | 1.50% |
| Games – Music | 55.8% | 3.90% |
| Games – Puzzle | 4.1% | 1.70% |
| Games – Racing | 27.7% | 2.20% |
| Games – Role Playing | 6.5% | 1.30% |
| Games – Simulation | 12.0% | 1.50% |
| Games – Sports | 18.6% | 2.10% |
| Games – Strategy | 8.5% | 1.20% |
| Games – Trivia | 79.9% | 6.90% |
| Games – Word | 5.0% | 1.50% |
| Health & Fitness | 43.1% | 5.20% |
| Lifestyle | 37.0% | 7.80% |
| Magazines & Newspapers | 34.1% | 2.10% |
| Medical | 23.4% | 2.40% |
| Music | 29.0% | 5.40% |
| Navigation | 58.2% | 7.90% |
| News | 31.3% | 4.70% |
| Photo & Video | 65.9% | 4.80% |
| Productivity | 57.3% | 7.40% |
| Reference | 52.6% | 10.30% |
| Shopping | 49.5% | 7.80% |
| Social Networking | 30.1% | 4.30% |
| Sports | 20.1% | 3.10% |
| Travel | 42.2% | 8.50% |
| Utilities | 61.0% | 7.40% |
| Weather | 86.0% | 3.80% |
2. Average App Conversion Rate in Google Play
Google Play Conversion Rate Benchmarks
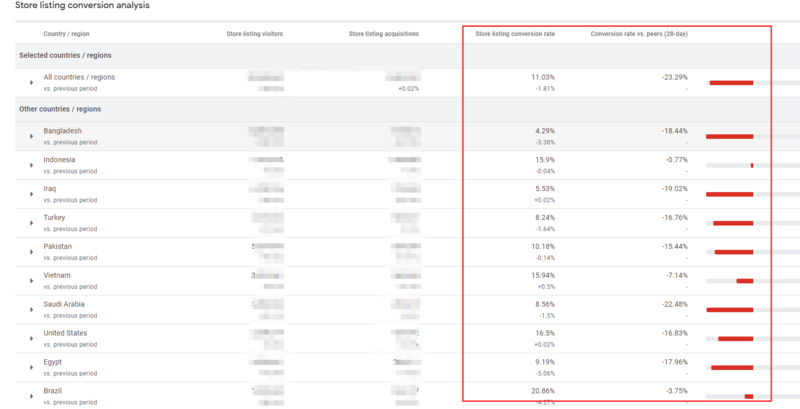
Google Play has native conversion rate benchmarks. Its store listing conversion rate chart allows you to compare your daily conversion performance to your peers’ median, 25th, and 75th percentile. The breakdown table allows you to compare your total conversion rate for the period with your peers’ median for the last 28 days in the selected period.
Note: Benchmarks are only available when viewing performance by country, language, install state, or traffic source. Filters for these dimensions are also supported for up to one selection per dimension.
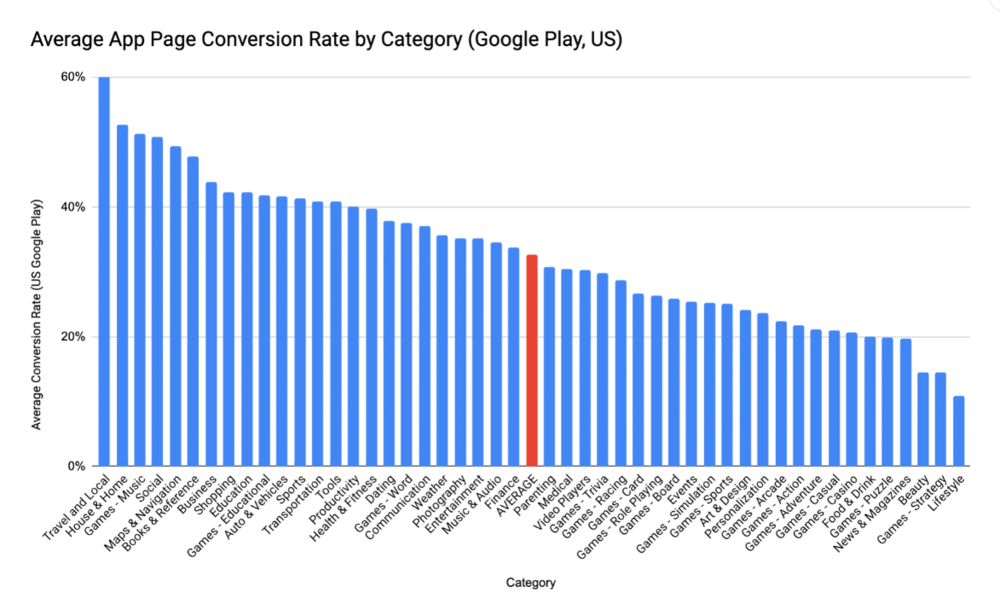
Average Conversion Rate on Google Play US Store
In 2022, the average conversion rate on the US Google Play Store was 32.7% and thus higher than the average CVR on the App Store (31%). The Travel and Local category had the highest average CVR of 60.2%, while the Lifestyle category had an average CVR of only 10.8% on Google Play.
3. What Are App Conversion Rates Affected by?
Traffic Mix
Blended conversion rate (without segmenting to traffic type) mean very little. For example, app that does a lot of paid UA won’t be comparable to an app that gets organic traffic. Usually, the conversion rate of organic traffic is much higher than that of paid traffic.
UA Quality
Extremely targeted traffic will convert at a higher rate than a low-quality ad network.
Category
For example, a mobile game and a social app aren’t comparable as the user’s intent is completely different.
Country
Even using the same UA strategies, your app will have higher conversion in some countries while other not. Usually, users from developed countries are pickier which results in lower conversion rate and bad reviews.
So, when using benchmarks, ensure that you have taken these factors into consideration.
Final Words
With Conversion Rate Benchmarks, you can compare your conversion rates, install rates, and click-through rates with other apps in your industry! However, the conversion rate is affected by many factors and vary from time to time. No matter what your app’s CVR is now, you should keep to increase the CVR by improving your screenshots, feature graphics, icons, keywords, ads and so on.